Bannister Lake Chameleon Drives Data Aggregation at the US Open

A daily selection of features, industry news, and analysis for AV/IT professionals. Sign up below.
You are now subscribed
Your newsletter sign-up was successful
Late each August, a 46.5-acre section of Flushing Meadows park in Queens, NY comes alive with a rally of athletic activity. For two weeks, the USTA Billie Jean King National Tennis becomes a veritable city of sport, a hotbed of perpetual action that is the US Open.
Contested at the current location since 1978, the tournament draws 632 of the world’s best tennis players to compete in some 800 matches on 22 courts over the course of 14 days. Fans trying to keep tabs on all of the action certainly have their work cut out for them.
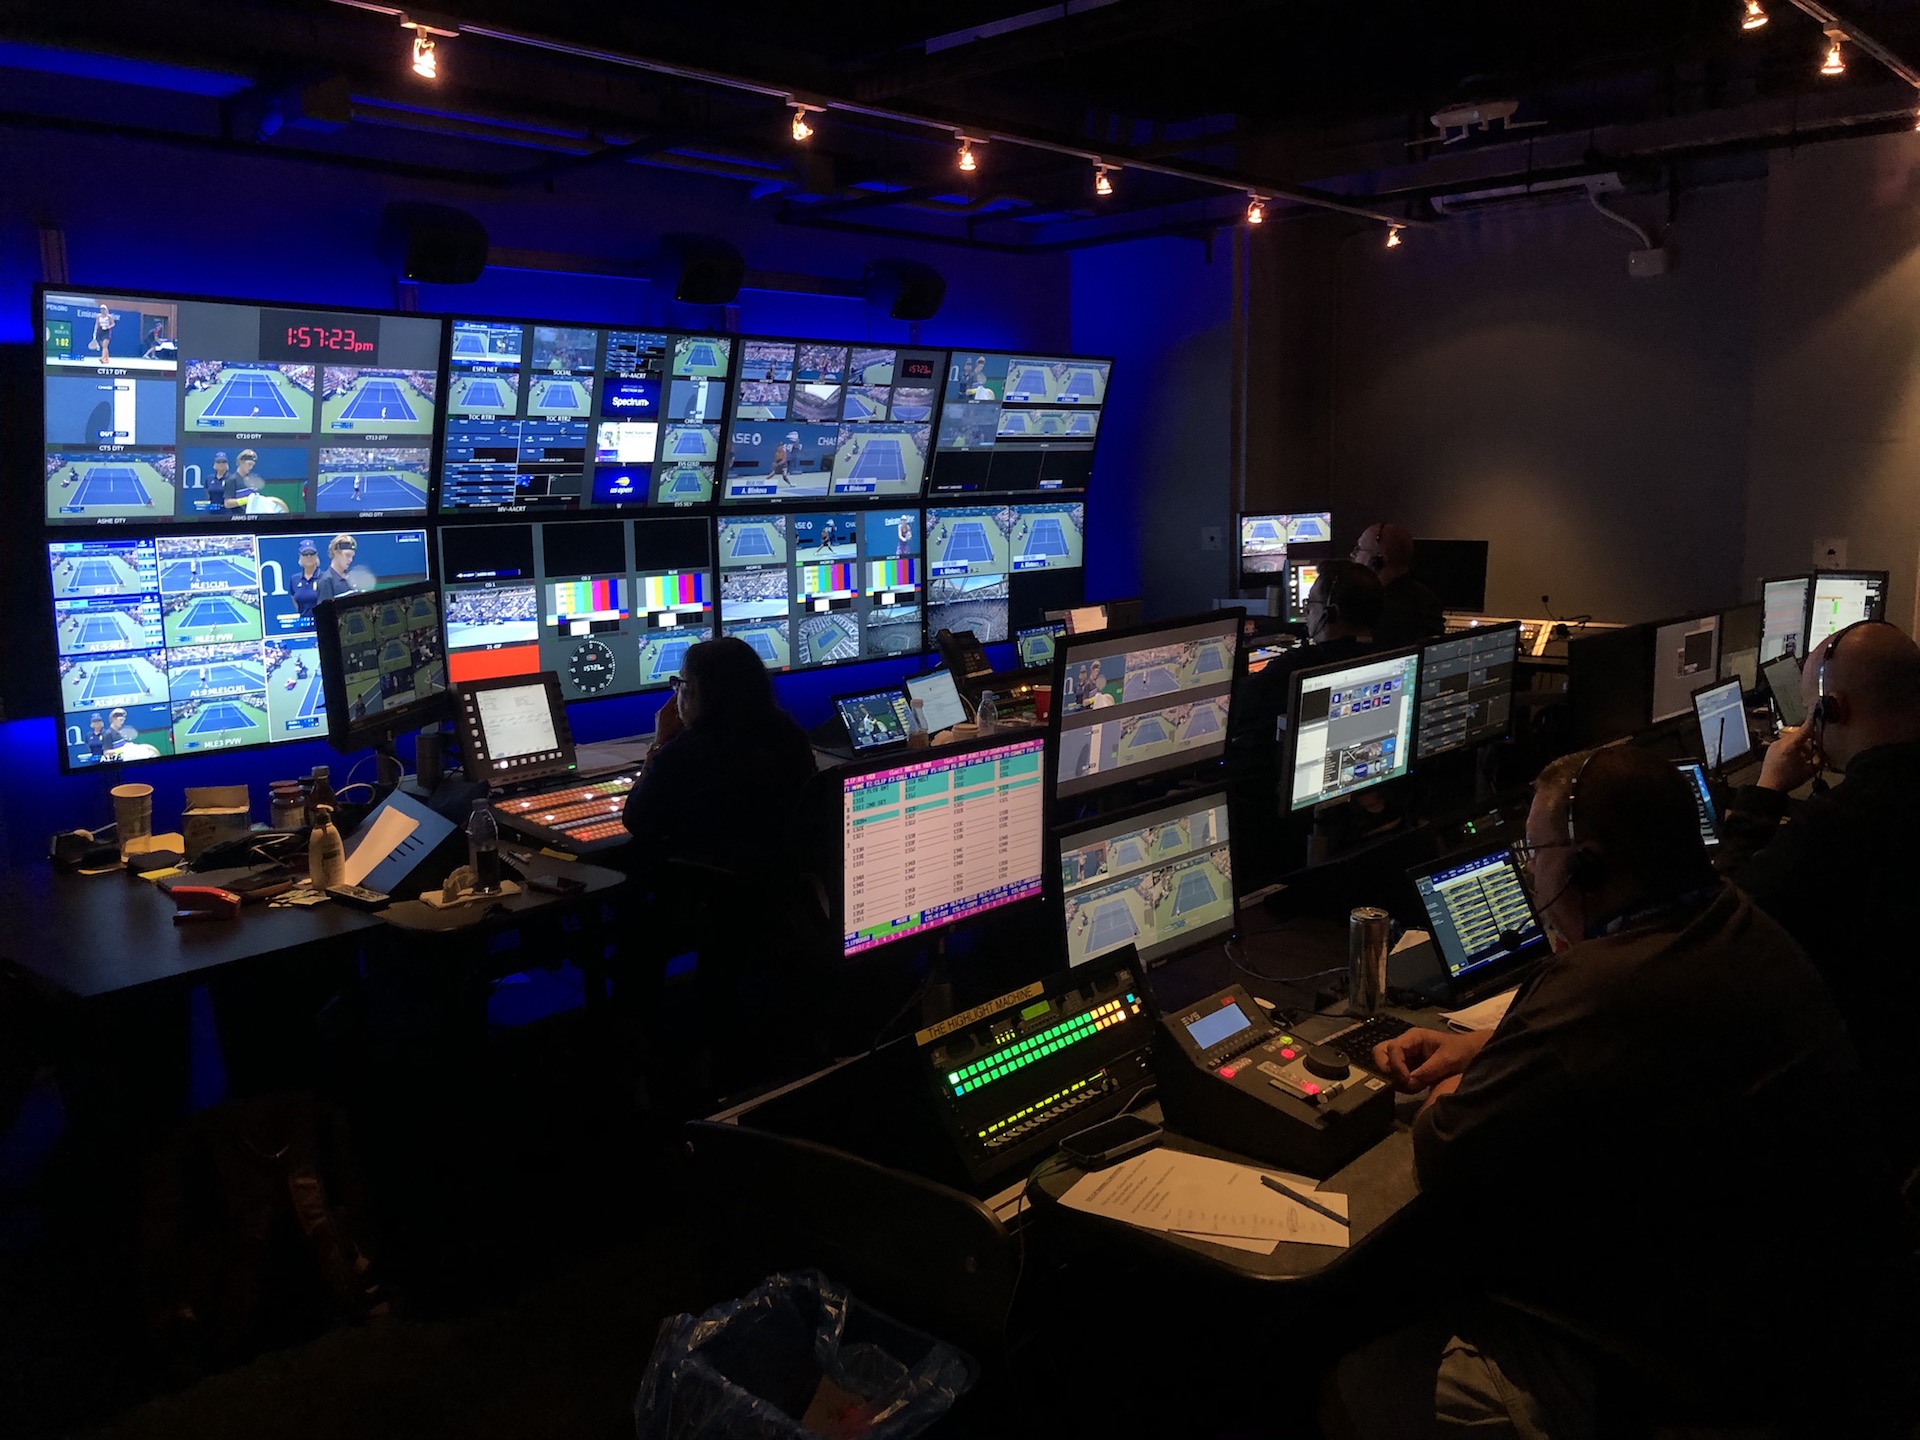
Enter big data and AV. Since 2018, Van Wagner Sports and Entertainment, the live events company in charge of the technical production at the tournament, has called upon Bannister Lake to handle data aggregation and moderation for the US Open. From a control room in Louis Armstrong Stadium—the second-largest and newest venue on the campus—Bannister Lake’s creative and technical director Al Savoie operates the systems that fill the dozens of LED displays around the tennis center with all manner of stats and content.
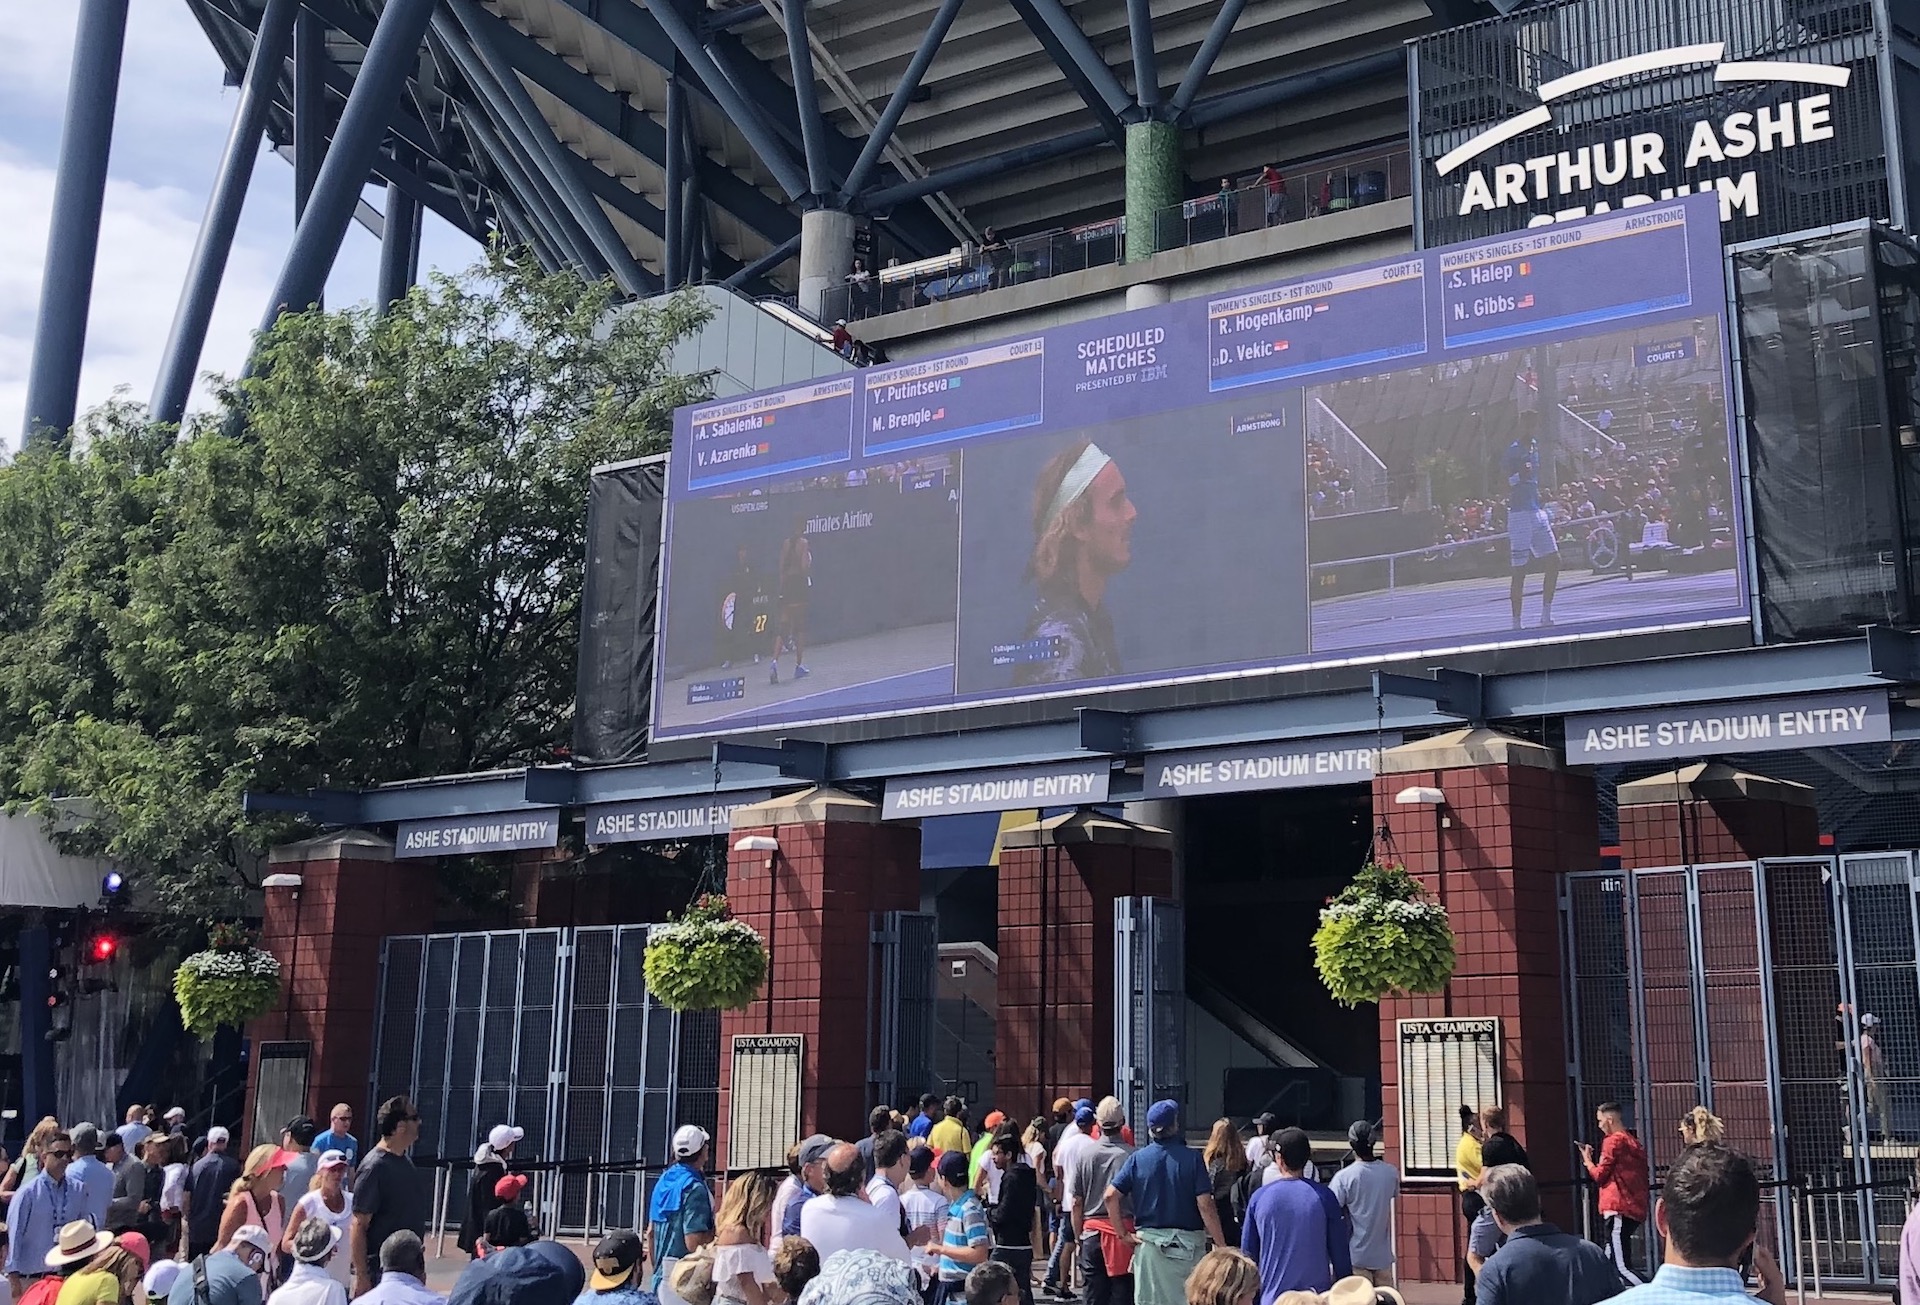
“I’m handling most of the signage from around the grounds,” he said. “All of this stuff is driven by data coming in from SMT, an IBM service that basically collects data from all the stadiums, all the courts and practices, and then we take in all their feeds and organize it into a central database. And from there, we pick and choose on which screens we want to see what, and scheduled at what time. And this includes everything from social media, to practice schedules—whatever you want.”

Some of the displays are inside the stadiums, including a brand-new LED walls at court level in Arthur Ashe Stadium, where the biggest matches and championship rounds are played. Other diplays are positioned around the grounds of the facility and show live video feeds of the matches produced by the Van Wagner team, as well as match info that Savoie programs.
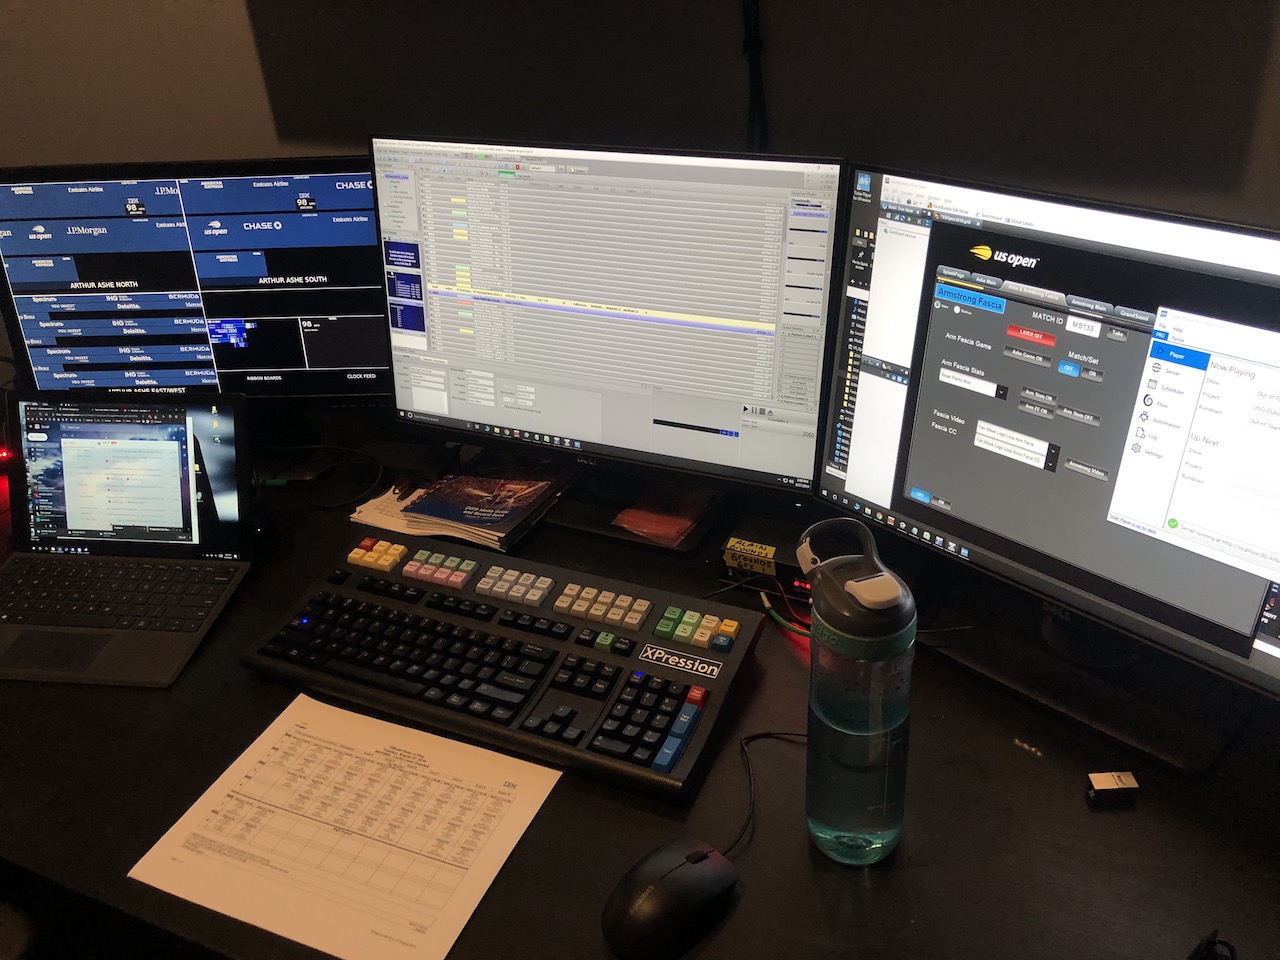
The IBM data is processed by Chameleon, Bannister Lake’s all-in-one solution for branding, tickers, data aggregation, scheduling, and graphics. “At any given time we can say, ‘Oh we want to see Women’s Singles 128,’ so I can type in ‘Women’s Singles 128’ and it’ll find that match and it’ll include everything from the status, the winner, the sets, headshots, and match stats for that particular game,” Savoie said. “So at any given time we can just into the software, find the match, and get everything we need, and then call it up and put it on the screens.”
This is done using Ross Video XPression, the rendering engine used to produce the graphics. Savoie creates the templates for the scoring graphics ahead of time, then the Chameleon software automatically populates it. “I built most of the templates that you’re seeing, and it’s all intelligent in a sense that if it’s men’s singles or women’s singles or doubles, the name stats change in width and size [men’s matches are best of five sets, while women’s are best of three] and showcases the proper names and challenges remaining, the flags—all that stuff,” he said.
A daily selection of features, industry news, and analysis for tech managers. Sign up below.

Most of this content gets set automatically, according to Savoie. “At midnight or sometime overnight, SMT sends out the next day’s schedules,” he said. “So I walk in for the day and all of the scheduled matches are already populated.” From there, the team just needs someone to moderate the social media feeds and select pictures to display during breaks in the action. And, of course, Savoie is always at the ready in the event that intervention is required. “There was a storm a couple days ago, where they did want to put up immediate custom messaging ‘Take shelter: lightning striking,’” he said. “In that scenario, someone might have to enter text.”
The system also pulls data from other sources in addition to the tennis feeds. “The data we take in is pretty much any data,” Savoie said. “We’re pulling weather from our weather readers, so it’s populating that automatically. We can take in MTA information, so subway and bus information, and showcase subway or train delays.”
While the Chameleon software runs locally on a server in the Armstrong control room, the network is on a cloud instance, according to Savoie. This enables other teams involved with the event to create messaging and have it appear throughout the facility. “The US Open’s marketing people can enter custom messages remotely,” he said. “They build them, they create an expiration time for them, or even a scheduled time for them. So if there’s an autograph session happening somewhere, they can schedule that message to appear at say, 3 p.m. and it’ll go up then.”
Now in his second year operating Chameleon at the tournament, Savoie said that most of the production work is the same as last year. “It’s mostly polishing some stuff, making some of the scenes more efficient,” he said. “But it’s mostly on the backend, the graphics side of things—not so much the workflow or data side.”

The biggest change this year, he said, is the addition of the new LED panels in Arthur Ashe Stadium. Installed before this year’s tournament, the displays cover the entire back wall on either end of the court and display sponsorship logos, serve speeds, and the match clock. “That screen is a major add-on,” Savoie said. “Being able to quickly call up elements on that screen was a huge bonus.”
According to Nathan McCoart, director of technical operations at Van Wagner Sports and Entertainment, the Bannister Lake data aggregation has been a welcome enhancement to the production team’s workflows. “It’s made things easier for sure,” he said. “From the executive production side of things, I understand the large amount of information that we’re working with, and having a way that organizes it so that someone like Al can quickly turn different scenes around [has been helpful]. It’s really trying to bring that depth and breadth of information from scores, to messaging, to social, into one format that fans are kind of used to seeing from watching ESPN at home.”
And ultimately, the data helps fulfill one of the primary goals of the production team: fan engagement. “We’re trying to keep everyone informed, and stay engaged with all the things happening around the campus,” McCoart said. “Not just [Roger] Federer and [Rafael] Nadal playing in Ashe, but you may also have another great match on court six or court five. So we’re really trying to disperse that collection of information to people all over the place.”
Matt Pruznick is the former editor of AV Technology, and senior editor for Systems Contractor News and Residential Systems. He is based in New York.

