In the first quarter 2008 edition of PRI Quarterly Retail Analytics, we advanced two key positions, to wit: that the US economy entered into a recession in October-November of 2007; and that the ensuing recession would not be very deep or very long. We believe that most economists are, in a sense, like politicians. That is, neither is held to atone for their past mistakes. At PRI, we have no such luxury.
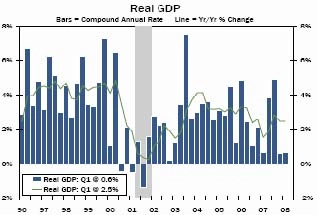
Regarding our former position, we maintain our stance that the US is in a recession, despite the fact that the current business cycle may not fit that classical definition. Better than expected, yet still weak, first quarter Gross Domestic Product rose 0.6 percent on an annual basis (Versus an annual rate of 2.2 percent in 2007, 2.9 percent in 2006, and 3.1 percent in 2005, see Charts 1a and 1b). The personal spending portion of GDP rose 1.0 percent in the quarter, the weakest quarterly increase since 2001. As just expressed by the Fed: “[r]ecent information indicates that economic activity remains weak…,” and continuing that “financial markets remain under considerable stress, and tight credit conditions and the deepening housing contraction are likely to weigh on economic growth over the next few quarters.” Bernard Baumohl, managing director of the Economic Outlook Group, stated it this way: “undefinedt would be a grave mistake to interpret [the GDP] number as even suggesting the economic and financial crisis is over…” Simply, it cannot be rationally said that the US economy is healthy.
- Chart 1a. Source: Wachovia. (CLICK TO ENLARGE)
Chart 1b. (CLICK TO ENLARGE)
Concerning our later prediction, we are modifying our viewpoint, having underestimated the current problems that are infecting the US economy. In summary, it is our perspective that as banks continue to concentrate on shoring up their balance sheets, which will have a negative impact on their ability to lend, consumers will likewise be forced to buttress their personal balance sheets, which will affect their ability to spend.
During March, the credit markets froze, the stock market tumbled, the dollar dived, and gold and oil prices soared. In April, most of these trends continued (a stock market rebound being the exception), compounded by the fact that employment is weakening, the housing fallout is expanding, and inflation is picking up. We now believe the recession that the US economy has entered will last the balance of this year, longer than originally forecast.
We predicated our earlier position on four major themes. These were that the real estate debacle was capable of being contained, that the misguided stimulus package coming out of Washington might help, the continued presence of low interest rates would result in banks making loans, and that employment was still relatively strong. So what has changed?
1. The real estate market continues to be problematic. Sales of new single-family homes fell 8.5 percent in March, following a 5.3-percent decline in February. New single-family home sales are down 63.1 percent in March from their high in July 2005, for a 16-year low (see Chart 2). On a year-to-year basis, the median price of a new single-family home is down 13.3 percent (see Chart 3). The inventory of new unsold homes rose to 11 months in March, versus 10.2 months in February, the longest since 1981 (see Chart 4). Further, existing home sales fell 2 percent in March (see Chart 5); the price of an existing home is down 8.3 percent on a year-to-year basis, and off 12.8 percent from the July 2006 peak (see Chart 6). Residential construction fell at a 26.7-percent rate during the first quarter, the largest quarterly drop since 1981. Moreover, the number of U.S. homes heading toward foreclosure more than doubled in the first quarter from a year earlier. According to RealtyTrac, nationwide 649,917 homes received at least one foreclosure-related filing in the first three months of the year, up 112 percent from the same period last year (see Chart 7).
The ramifications from this are apparent. Many homeowners are watching the equity in their homes being materially affected, reducing their net worth. To the extent that they used cash-out equity loans to finance their lifestyle, this source of ready cash is now gone. Moreover, if either the primary or the secondary mortgage was financed with a low or no equity or reset mortgage, this homeowner is being further squeezed. All this has a negative impact on these consumers’ ability to spend. In addition, the fallout from the residential real estate market is influencing commercial construction as well. According to McGraw Hill Construction, retail construction starts are expected to fall by 12 percent in 2008.

Chart 2. (CLICK TO ENLARGE)

Chart 3. (CLICK TO ENLARGE)

Chart 4. (CLICK TO ENLARGE)

Chart 5. (CLICK TO ENLARGE)

Chart 6. (CLICK TO ENLARGE)

Chart 7. Source: RealtyTrac. (CLICK TO ENLARGE)
2. Washington’s misguided response. The impact from the economic stimulus package, or what we like to term a “get-out-the-vote dollar give-away,” will be short lived. At best, it might have an impact on third quarter consumer spending. We say minor because a portion of this windfall has or will be spent on higher energy and food costs, or perhaps to pay down consumer debt. According to Joseph LaVorgna, chief US economist at Deutsche Bank, “half of it is literally going to go to gas.” In any event, the effect of this stimulus package will expire by the time we enter into the fourth quarter, going into the always-important holiday selling period. Why this money is not being spent on jobs programs, infrastructure repairs, loans to underwater homeowners, etc. will forever remain a mystery.
3. Low interest rates do not equate to liquidity. Low borrowing costs are great, but do not help if lending remains tight. The Federal Reserve’s recent steps to inject liquidity into credit markets will, in time, address the major problems confronting credit markets, especially as related to market confidence.
Confidence is a major factor that influences financial markets. That is, confidence that credit is available, and that those who borrow can repay. As the availability of credit is an essential component that greases the gears of the US economy, confidence is a critical element affecting the availability of credit. Initially, the problems in the real estate market were perceived to be contained. Then the money center and investment banks started to mark-to-market sub-prime loans, among other investments. Write-down fear initiated a proverbial run-on-the bank mentality that started to grip financial markets; a spiral that caused financial institutions, for fear of further losses, to pull back from all forms of lending. See, for example, Chart 8, which illustrates that large commercial banks significantly increased their holdings of home mortgages and home equity loans during this housing cycle, now necessitating write-offs. It is this mortgage collateral, the single largest debt class in the US, that is now experiencing a severe decline in value. Simply stated, financial institutions were too leveraged and their risk management was not as strong as hoped, causing write-downs that impacted their capital structure. The result is sharply curtailed lending, while these institutions shore up their balance sheets.
Recent Fed activities, such as lending directly to commercial and investment banks, as well as reducing capital requirements on government-sponsored mortgage investors Fannie Mae and Freddie Mac, which will allow them to acquire an additional $200 B of mortgage securities this year will help, but this will take some time to filter down to ease the squeeze of mortgage and consumer debt.

Chart 8. (CLICK TO ENLARGE)
4. Employment is softening. The unemployment rate rose from 4.8 percent in February to 5.1 percent in March (see Charts 9a and 9b). Over the past 3 months, payroll employment has declined by 232,000. Last week, initial jobless claims rose by 35,000 and the number of workers remaining on jobless benefits climbed to a four-year high. The four-week moving average of new claims fell last week to 363,750 from 370,250.
Now a 5.1-percent unemployment rate is nothing to panic about. Yet it has been estimated that as much as 35 percent of new jobs added between the end of 2001, when the economy exited the last recession, and the end of the housing cycle peak, were housing related. If that is the case, continued weakness in housing as well as the general economy may result in a sharply increased unemployment rate. Advance indicators project the May 2nd employment report will detail a loss of another 60,000 jobs. However, the question is, will the unemployment rate reach 6 percent as some predict? If so, it will mean fewer consumers will have dollars to spend.

Chart 9. Source: Labor Department. (CLICK TO ENLARGE)

Chart 9b. Source: Federal Reserve Bank, San Francisco. (CLICK TO ENLARGE)
Other factors are also dragging on the economy, and having an adverse impact on our outlook for consumer spending. Rising energy costs are a problem, sucking away consumer disposable income (see Chart 10). Inflation is also becoming a worry. The Consumer Price Index increased 0.3 percent in March (see Chart 11). For the three months ended in March, the Index has risen at an annual rate of 3.1 percent versus a 4.1 percent gain for all of 2007. Moreover, the food price index for the first three months of the year has risen at an annual rate of 5.3 percent after a 4.9-percent increase in 2007 (see Chart 12). The more consumers spend on energy and food, the less they will have to go for discretionary expenses.

Chart 10. Source: Bureau of Economic Analysis, Haver Analytics, and AllianceBernstein. (CLICK TO ENLARGE)

Chart 11. (CLICK TO ENLARGE)

Chart 12. (CLICK TO ENLARGE)
Longer-term, we are starting to see some very early signs of life in the economy. Various leading economic indicators are beginning to signal this. We are hopeful that 2009 will mark the beginning of a gradual recovery. By way of comparison, see Chart 13, which illustrates the San Francisco Fed’s view that a rebound will occur as early as the second half of 2008.
The first of these indicators is the stock market, which is starting to rebound (see Chart 14). A slight recovery in the dollar and a ceiling on oil prices is starting to be reflected in the market. Likewise, the Chicago Fed’s National Activity Index improved fractionally to -0.78 in March from -1.28 in February (a negative value indicates below-average growth, representing weakness in economic conditions). The 3-month moving average also improved by a deminus amount: -0.86 in March from -.92 in February (see Chart 15). Finally, the Conference Board’s Index of Leading Economic Indicators moved up a fraction, 0.1 percent in March, following five consecutive monthly declines. On a year-to-year basis, the Index declined 1.8 percent in the first quarter of 2008 (see Chart 16).

Chart 13. Source: Federal Reserve Bank San Francisco. (CLICK TO ENLARGE)

Chart 14. (CLICK TO ENLARGE)

Chart 15. Source: Chicago Federal Reserve. (CLICK TO ENLARGE)

Chart 16. Source: Northern Trust. (CLICK TO ENLARGE)
RETAIL TRENDS
Retail sales rose in March by 0.2 percent, following February’s -0.4-percent decline. On an annualized basis, retail sales are up 0.7 percent for the trailing 3-months, and are up 2.0 percent for the trailing 12 months. Yet this better than expected result (which is still anemic) is put into perspective when auto and service station sales are excluded. Retail sales, ex. autos and gas, were flat in March, following February’s -0.1-percent decline. On an annualized basis, retail sales ex. autos and gas are up 0.0 percent for the trailing 3-months, and are up 1.3 percent for the trailing 12 months. An interesting view of the health of retail is gleaned by charting sales adjusted for inflation (see Chart 17). These limp retail sales results illustrate a weakening consumer-spending trend. Other evidence indicates that this pattern will continue for a while.

Chart 17. Source: Northern Trust. (CLICK TO ENLARGE)
Consumers drive the US economy, accounting for almost 72 percent of GDP (see Chart 18). Historically, it has been the free spending consumer who pulls the economy out of the doldrums. Year after year, we are told that the consumer is tapped out, with nothing left to spend, only to be surprised at the resiliency of our fellow Americans. Can the US consumer save the economy yet again in 2008, or will the Grinch, in fact, spoil Christmas?

Chart 18. (CLICK TO ENLARGE)
We think that this time things are different, and that consumer spending will contract. The trend in slowing retail sales supports this view. Rising energy costs, inflation, and a deteriorating job market are, as detailed above, part of the problem. This is compounded by the reality that for most Americans, their homes are their most leveraged and largest asset. A 10- to 20-percent retreat in housing prices can wipe out all their equity (see Chart 19, illustrating the decline in homeowners’ equity), resulting in a serious dose of financial restraint. Add to this some negative consumer confidence numbers, and we think that we can make a strong case for our forecast that consumers will pull back on spending for the balance of the year.

Chart 19. (CLICK TO ENLARGE)
While real estate prices were rising and interest rates were low, extracting cash made sense, providing little incentive to save. Households were spending more than they were earning after taxes (see chart 20), and consumer spending as a percent of disposable personal income reached a high not seen in 50+ years (see Chart 21). Relatively low interest rates were encouraging households to borrow in ever-increasing amounts (chart 22). The result is that household borrowing will not be available to fuel spending. Consumers are experiencing their highest leverage ratios in the post-WII period, combined with low levels of liquidity. As we stated in our last Retail Analytics Report, this is a consumer recession.

Chart 20. (CLICK TO ENLARGE)

Chart 21. (CLICK TO ENLARGE)

Chart 22. Source: Northern Trust. (CLICK TO ENLARGE)
For those with a spending monkey on their back, an option might have been turning to credit cards to pay for all those things you neither need nor can afford. However, distress is beginning to be signaled in the consumer loan markets as well, evidenced by the recent rise in delinquency rates for these loans (see Chart 23). While still below historical rates, credit card usage has turned up sharply since the beginning of 2006, as have default rates, which points to an increased strain on consumers to meet their debt obligations. Thus, this means consumers have less plastic money to spend as well.

Chart 23. (CLICK TO ENLARGE)
The impact on consumer purchase behavior is now starting to manifest itself. Personal income rose by 0.5 percent in February (falling to 0.3 percent in March). Yet consumer spending rose by only 0.1 percent in the February (0.4 percent in March). The year-to-year change in inflation-adjusted consumer spending is 1.66 percent, the smallest increase in five years. For the 1st quarter, Disposable Personal Income (after-tax cash available to spend or save) rose 1.4 percent, while spending rose 1.0 percent. In the Federal Reserve’s Beige Book, released on 16 April, it was stated, “[c]onsumer spending was characterized as softening across most of the country.” It is apparent that consumer spending is weak. This indicates that consumers may be starting to accrue, rather than spend all their money (and then some) to rebalance their personal finances.
Finally, yet another bad signal for consumer spending are the confidence surveys. Seems the happier we are, the more we go to the mall. Both the University of Michigan’s and the Conference Board surveys point to negative sentiment.
The overspent US consumer, fueled by too much credit, is now being forced to correct for past sins. This will result in reduced spending and increased savings for the balance of 2008.
Building Materials, Garden and Supply Stores
Sales fell 1.6 percent in March, following a decrease of 0.1 percent in February. On an annualized basis, sales are down 10.3 percent for the trailing 3-months, and are down 6.9 percent for the trailing 12 months.
Food and Beverage Stores
Sales rose 0.3 percent in March, following a decrease of 0.1 percent in February. On an annualized basis, sales are up 2.9 percent for the trailing 3-months, and are up 4.6 percent for the trailing 12 months.
Autos
Sales rose 0.2 percent in March, following a decrease of 1.2 percent in February. On an annualized basis, sales are down 3.4 percent for the trailing 3-months, and are down 3.2 percent for the trailing 12 months.
Clothing and Accessory (Apparel) Stores
Sales fell 0.5 percent in March, following a decrease of 0.9 percent in February. On an annualized basis, sales are up 2.5 percent for the trailing 3-months, and are down 1.6 percent for the trailing 12 months.
General Merchandising Stores
Sales fell 0.6 percent in March, following an increase of 0.3 percent in February. On an annualized basis, sales are down 2.8 percent for the trailing 3-months, and are flat for the trailing 12 months.
Department Stores
Sales were flat in March, following an increase of 0.1 percent in February. On an annualized basis, sales are down 4.8 percent for the trailing 3-months, and are down 4.1 percent for the trailing 12 months.
PRI’s mission is to initiate and secure the funding of studies on specific retail business issues. PRI functions as a conduit, bringing together retail executives with leading researchers. The genesis of the Retail Institute is the recognition of the wealth of knowledge being produced at the University level, on the one hand, and the need for more advanced yet practical business research and insight at the retail level, on the other.
We are grateful to the following members of the Platt Retail Institute for their support.
R.S.P.A. - Retail Solutions Providers Association
Diversified Media Group
Wireless Ronin Technologies
Digital Signage Quarterly
AccuWeather.com
Levelvision
RDM - Real Digital Media
European Retail Academy
ReflectSystems
SCALA Broadcast Multimedia
Cleverdis - Information Intelligence
This report is not to be reproduced or published, in any form or by any means, without the express written permission of the Institute.
Copyright © PLATT RETAIL INSTITUTE 2008. All rights reserved.
